|
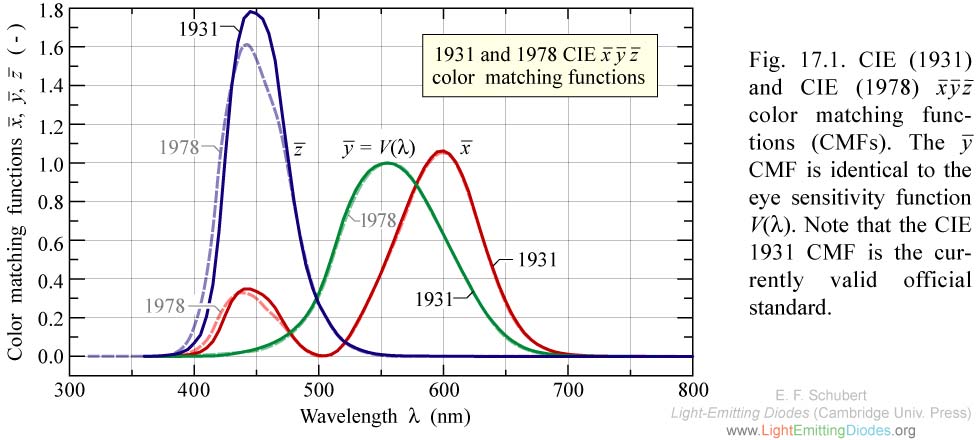
Fig. 17.1. CIE (1931) and CIE (1978) xyz color matching functions (CMFs). The y CMF is identical to the eye sensitivity function V(lambda). Note that the CIE 1931 CMF is the currently valid official standard.
|
|
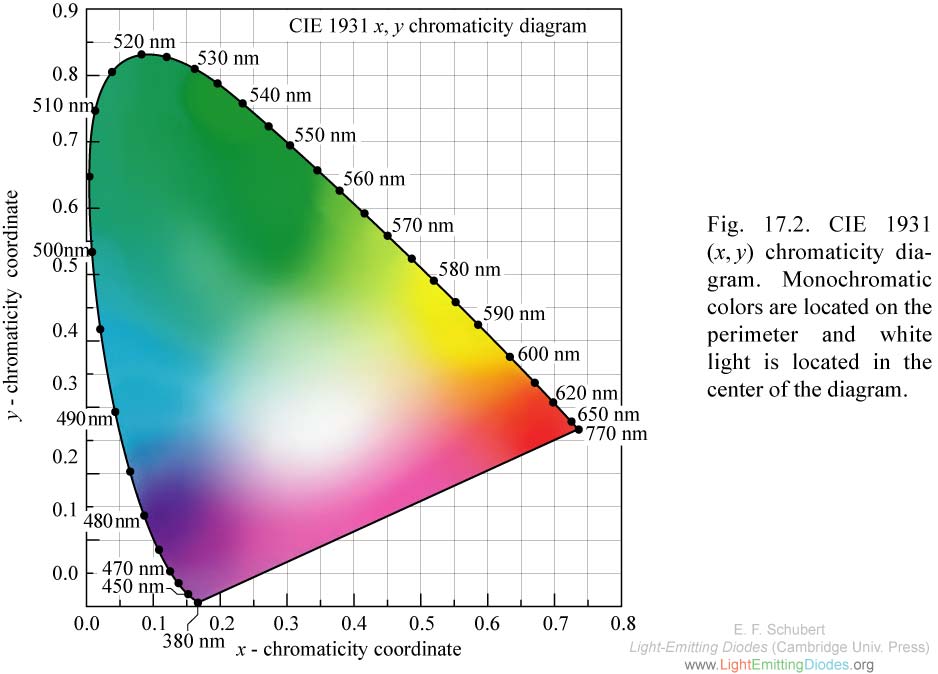
Fig. 17.2. CIE 1931 (x,y) chromaticity diagram. Monochromatic colors are located on the perimeter and white light is located in the center of the diagram.
|
.jpg)
|
Fig. 17.3. 1931 CIE chromaticity diagram with areas attributed to distinct colors (adopted from Gage et al., 1977).
|
|
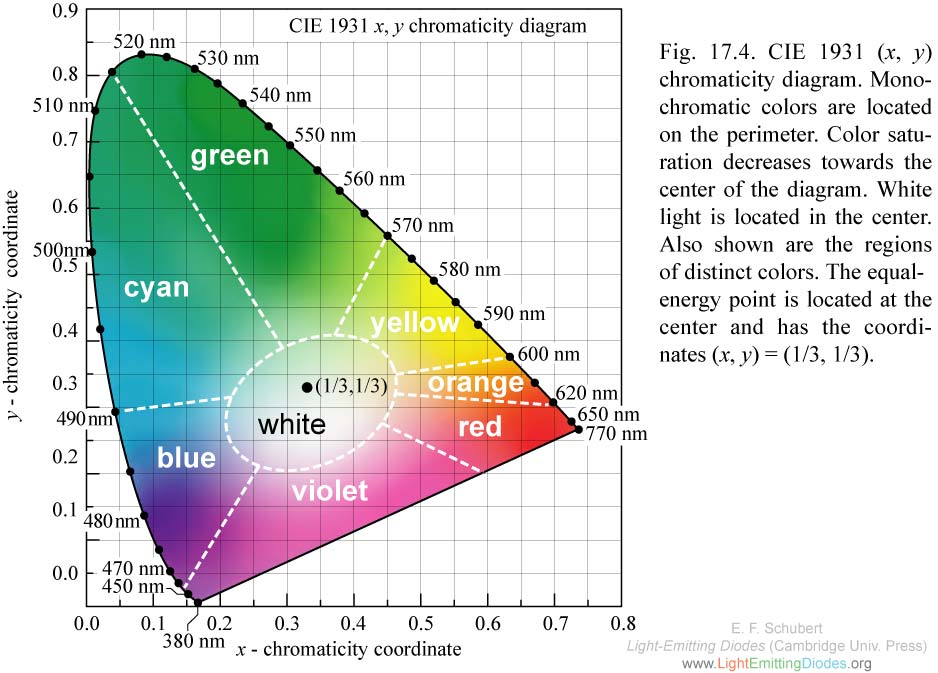
Fig. 17.4. CIE 1931 (x, y) chromaticity diagram. Monochromatic colors are located on the perimeter. Color saturation decreases towards the center of the diagram. White light is located in the center. Also shown are the regions of distinct colors. The equal-energy point is located at the center and has the coordinates (x, y) = (1/3, 1/3).
|
|
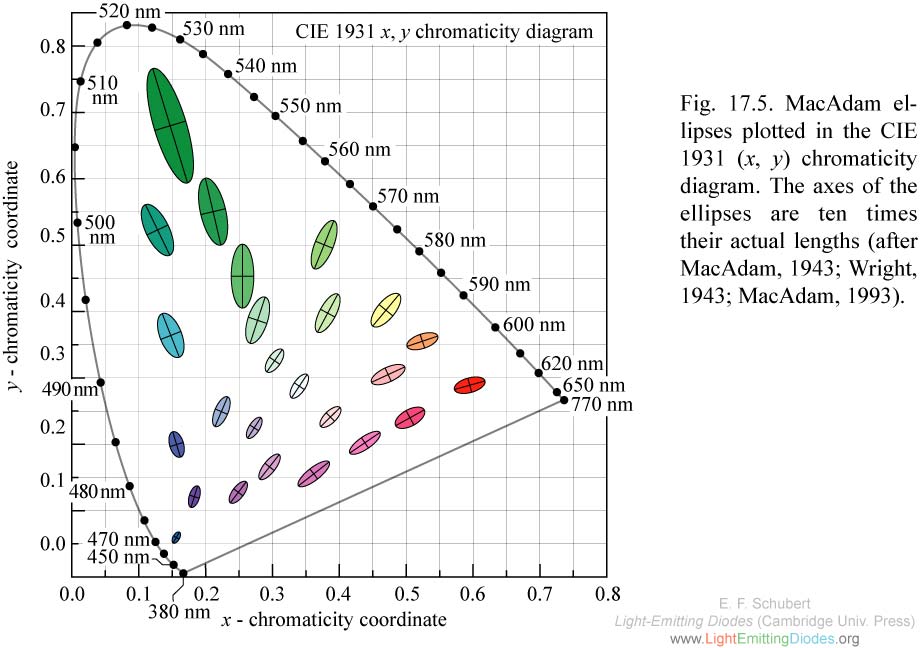
Fig. 17.5. MacAdam ellipses plotted in the CIE 1931 (x, y) chromaticity diagram. The axes of the ellipses are ten times their actual lengths (after MacAdam, 1943; Wright, 1943; MacAdam, 1993).
|
|
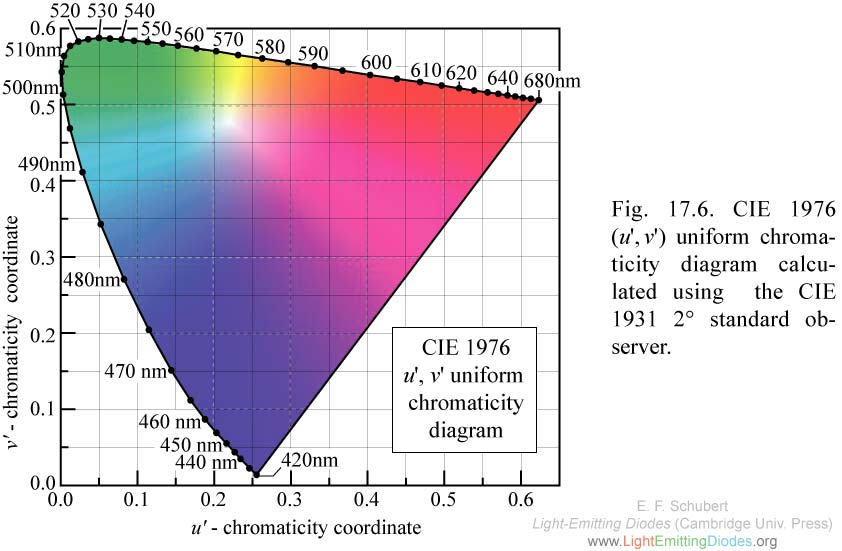
Fig. 17.6. CIE 1976 (u',v') uniform chromaticity diagram calculated using the CIE 1931 2° standard observer.
|
|
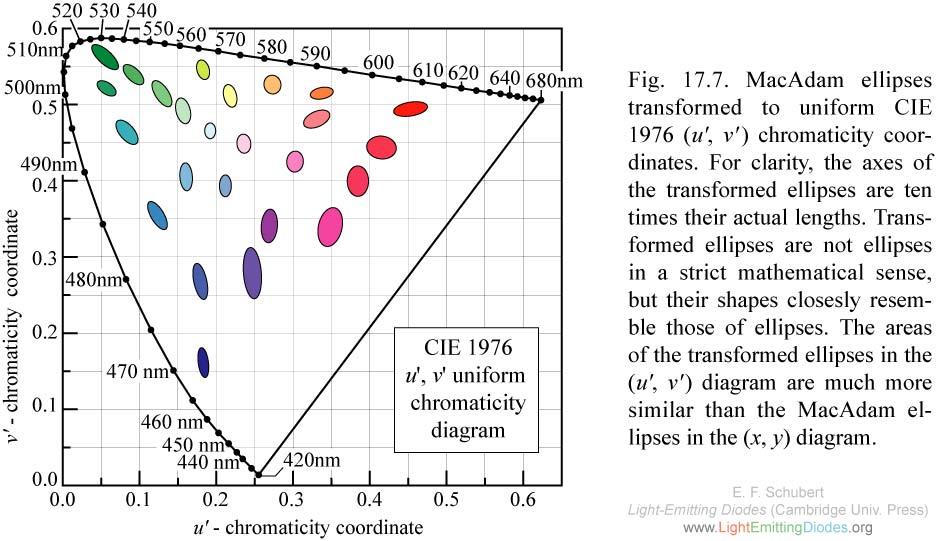
Fig. 17.7. MacAdam ellipses transformed to uniform CIE 1976 (u', v') chromaticity coordinates. For clarity, the axes of the transformed ellipses are ten times their actual lengths. Transformed ellipses are not ellipses in a strict mathematical sense, but their shapes closesly resemble those of ellipses.
|
|
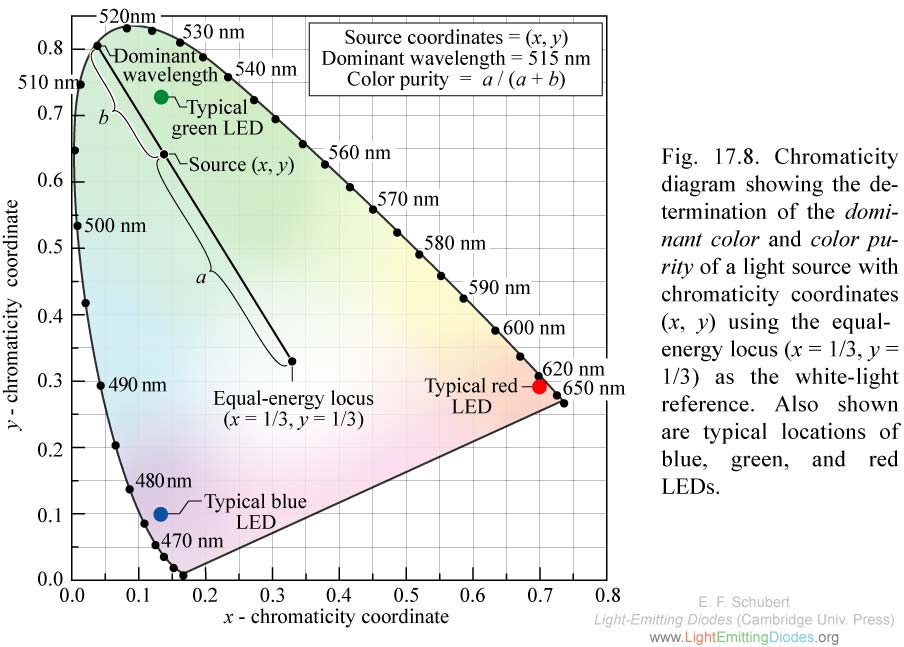
Fig. 17.8. Chromaticity diagram showing the determination of the dominant color and color purity of a light source with chromaticity coordinates (x, y) using the equal-energy locus (x = 1/3, y = 1/3) as the white-light reference. Also shown are typical locations of blue, green, and red LEDs.
|
|
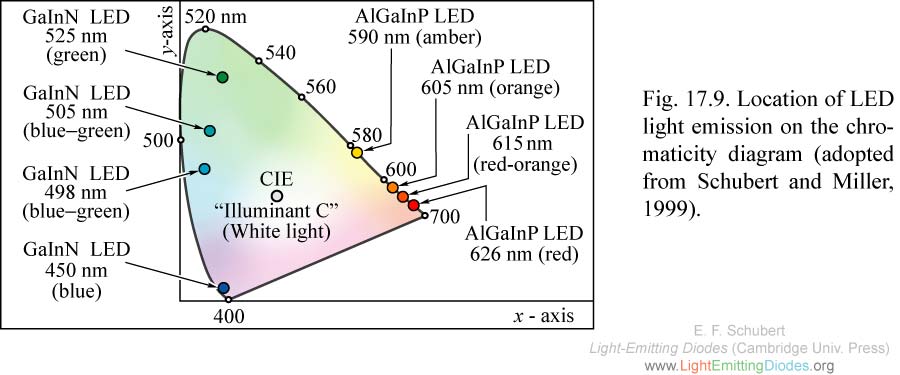
Fig. 17.9. Location of LED light emission on the chromaticity diagram (adopted from Schubert and Miller, 1999).
|