|
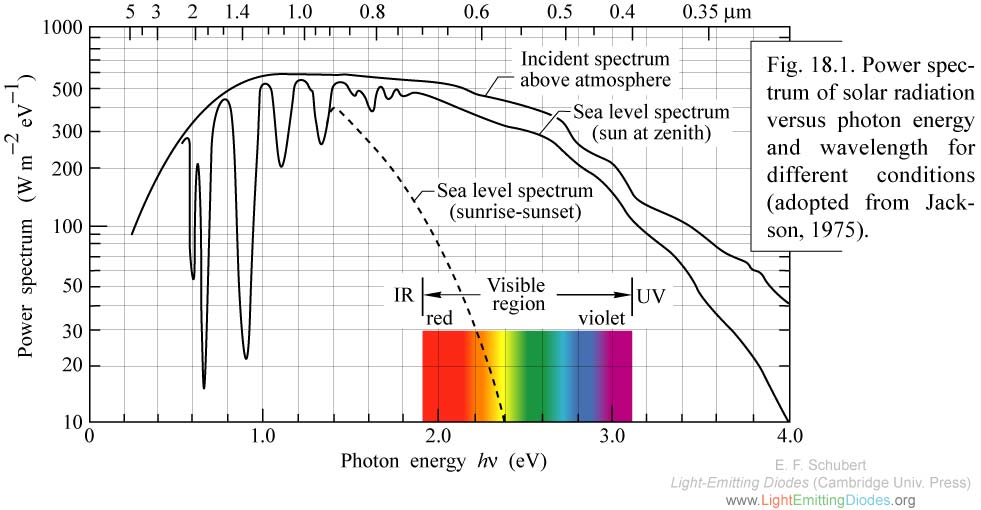
Fig. 18.1. Power spectrum of solar radiation versus photon energy and wavelength for different conditions (adopted from Jackson, 1975).
|
|
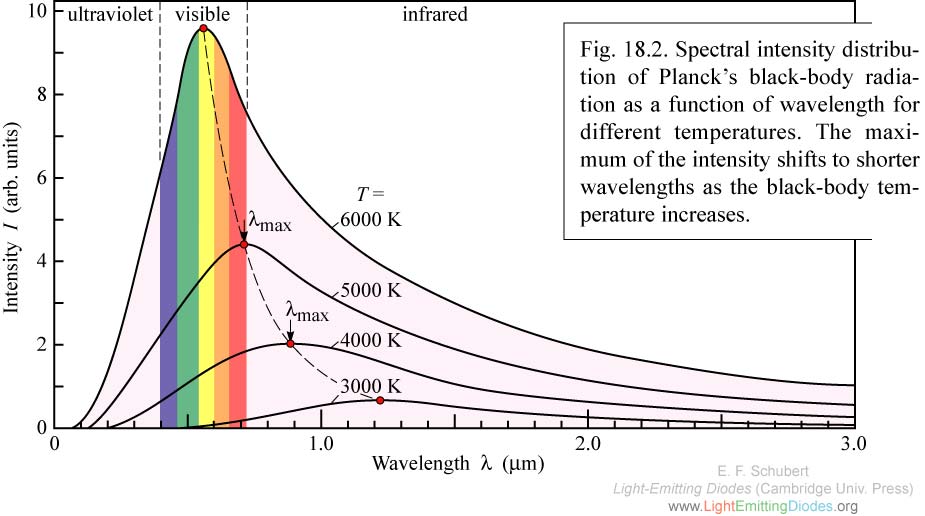
Fig. 18.2. Spectral intensity distribution of Planck’s black-body radiation as a function of wavelength for different temperatures. The maximum of the intensity shifts to shorter wavelengths as the black-body temperature increases.
|
|
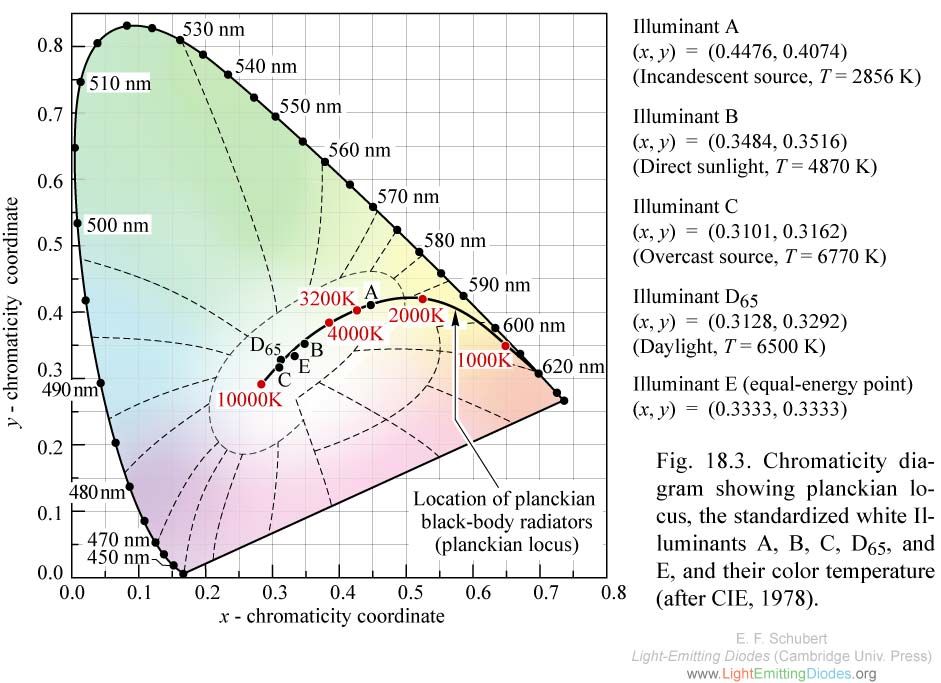
Fig. 18.3. Chromaticity diagram showing planckian locus, the standardized white Illuminants A, B, C, D65, and E, and their color temperature (after CIE, 1978).
|
|
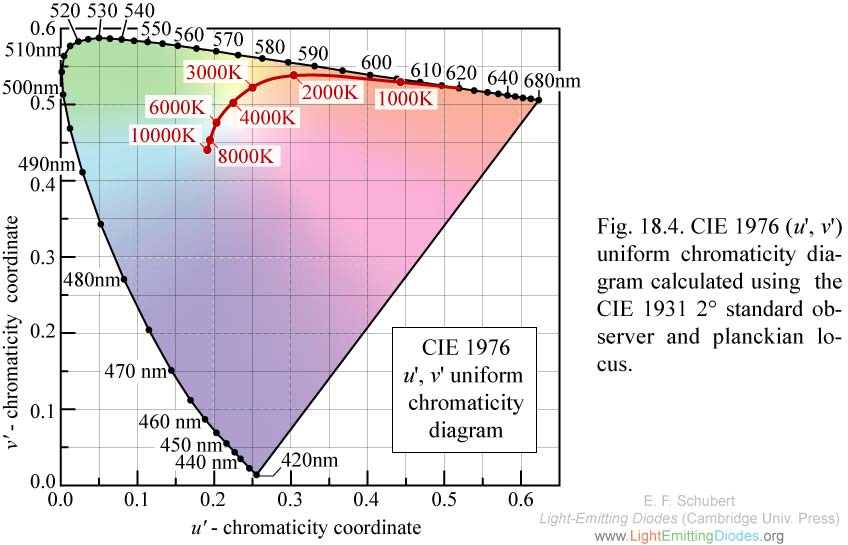
Fig. 18.4. CIE 1976 (u', v') uniform chromaticity diagram calculated using the CIE 1931 2° standard observer and planckian locus.
|
|
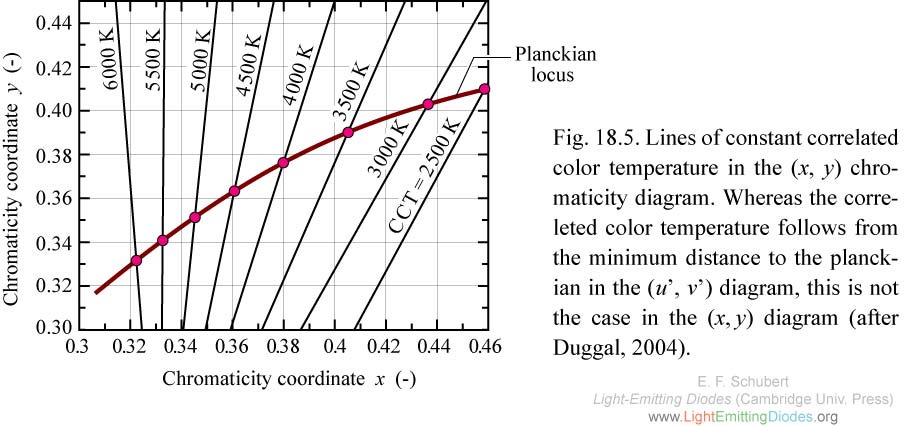
Fig. 18.5. Lines of constant correlated color temperature in the (x, y) chromaticity diagram. Whereas the correleted color temperature follows from the minimum distance to the planckian in the (u’, v’) diagram, this is not the case in the (x,y) diagram (after Duggal, 2004).
|