|
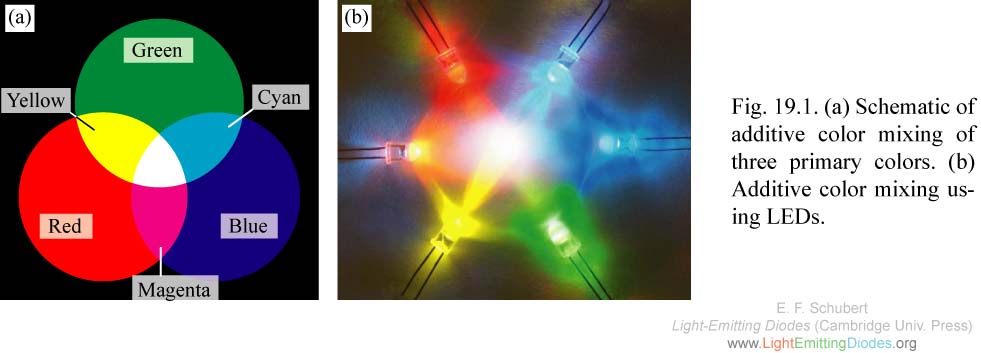
Fig. 19.1. (a) Schematic of additive color mixing of three primary colors. (b) Additive color mixing using LEDs.
|
|
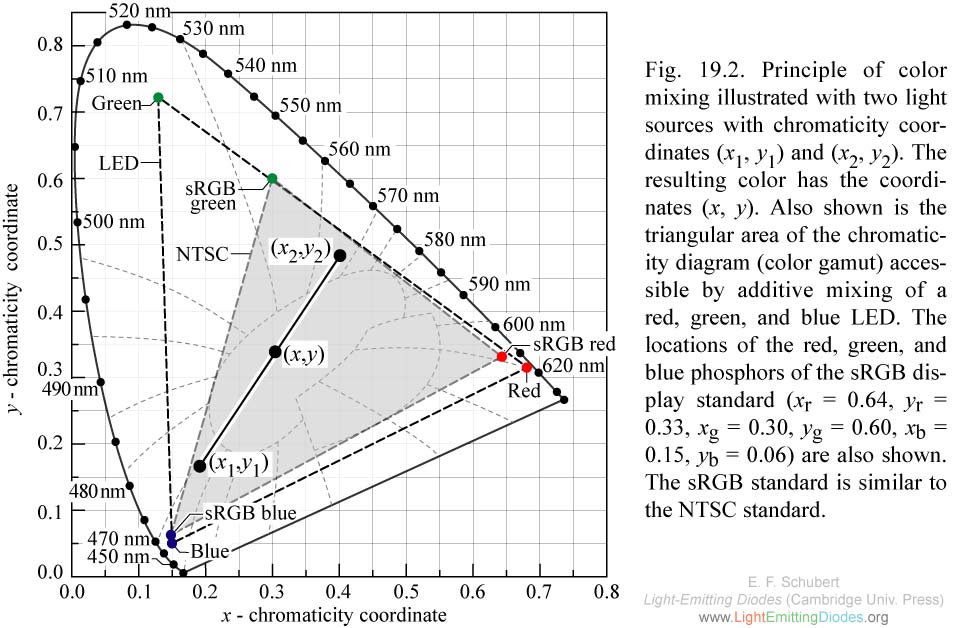
Fig. 19.2. Principle of color mixing illustrated with two light sources with chromaticity coordinates (x1, y1) and (x2, y2). The resulting color has the coordinates (x, y). Also shown is the triangular area of the chromaticity diagram (color gamut) accessible by additive mixing of a red, green, and blue LED.
|
|
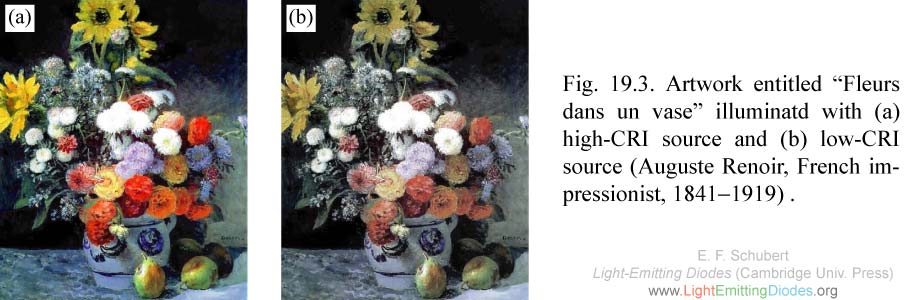
Fig. 19.3. Artwork entitled “Fleurs dans un vase” illuminatd with (a) high-CRI source and (b) low-CRI source (Auguste Renoir, French impressionist, 1841-1919) .
|
|
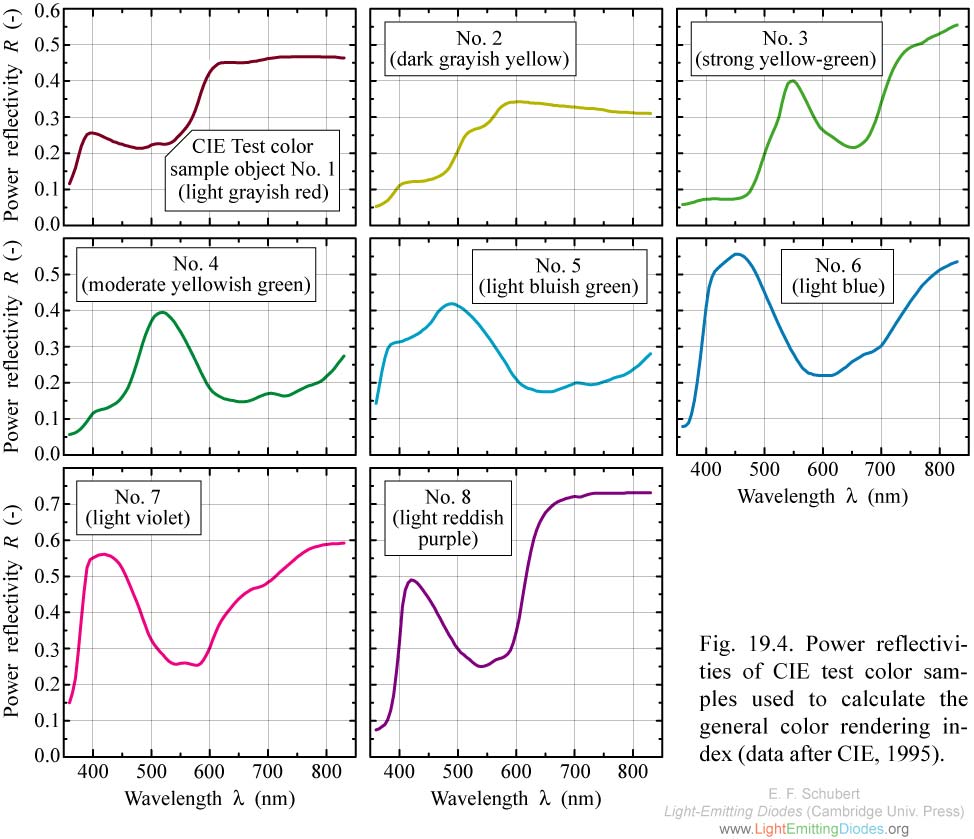
Fig. 19.4. Power reflectivities of CIE test color samples used to calculate the general color rendering index (data after CIE, 1995).
|
|
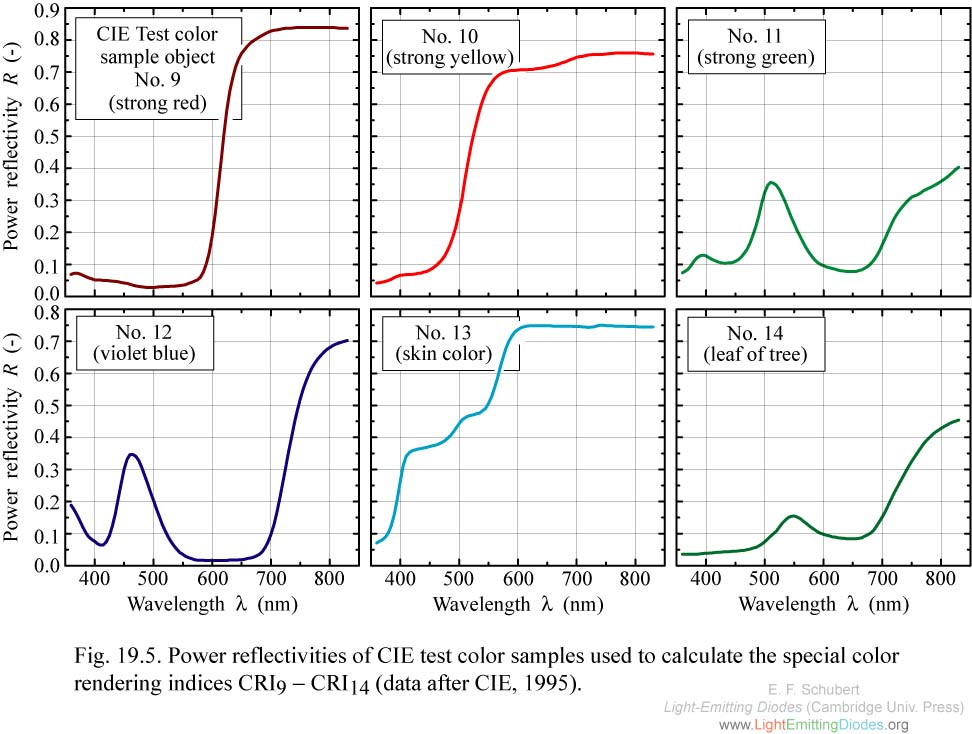
Fig. 19.5. Power reflectivities of CIE test color samples used to calculate the special color rendering indices CRI9 - CRI14 (data after CIE, 1995).
|
|
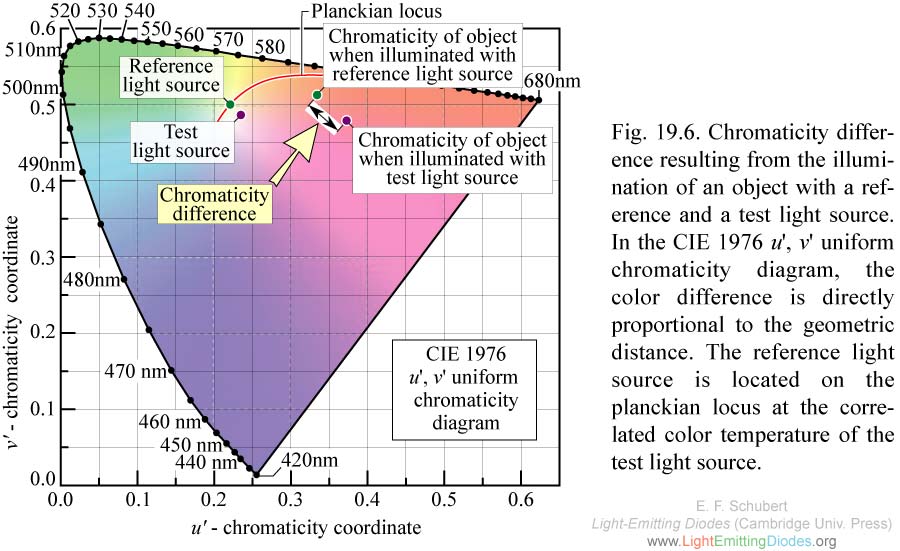
Fig. 19.6. Chromaticity difference resulting from the illumination of an object with a reference and a test light source. In the CIE 1976 u', v' uniform chromaticity diagram, the color difference is directly proportional to the geometric distance.
|
|
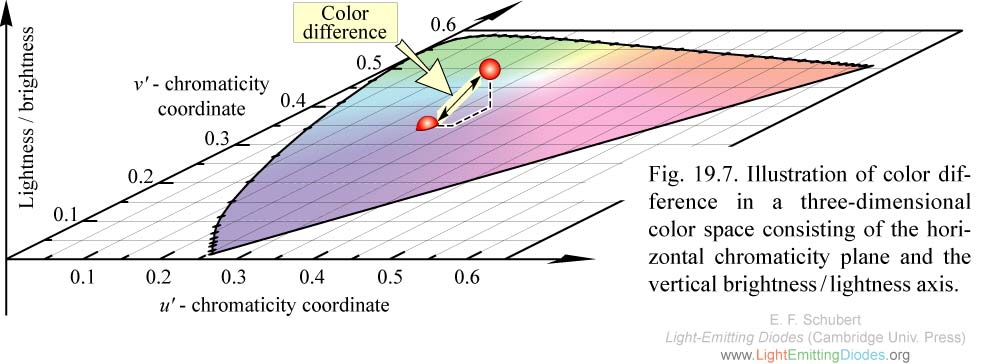
Fig. 19.7. Illustration of color difference in a three-dimensional color space consisting of the horizontal chromaticity plane and the vertical brightness/lightness axis.
|