|
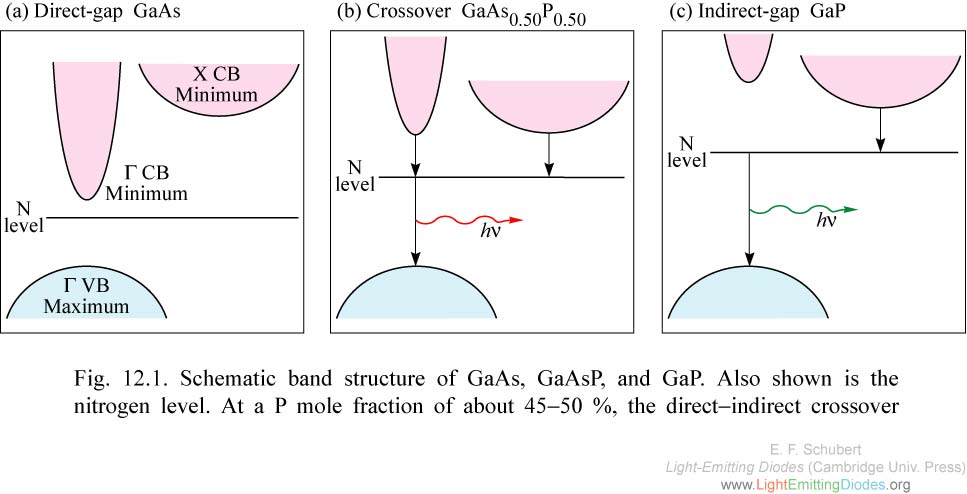
Fig. 12.1. Schematic band structure of GaAs, GaAsP, and GaP. Also shown is the nitrogen level. At a P mole fraction of about 45-50 %, the direct-indirect crossover occurs.
|
|
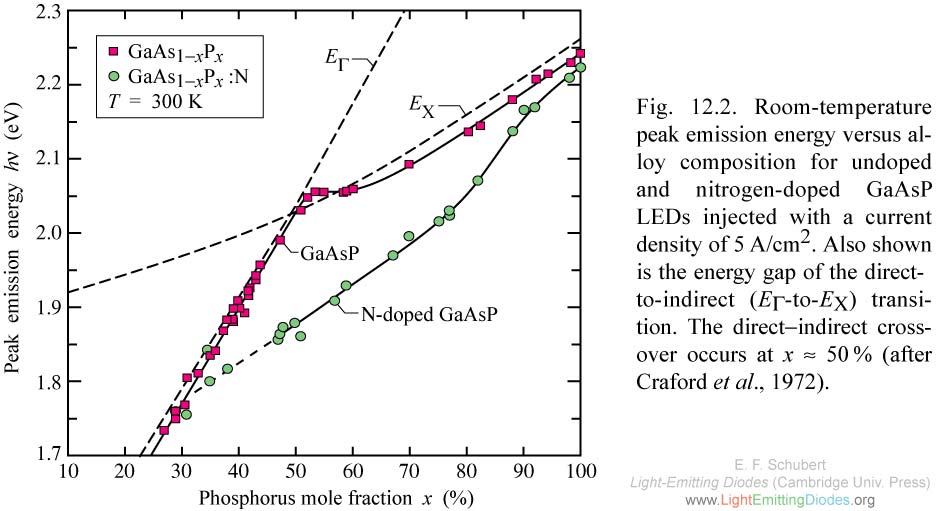
Fig. 12.2. Room-temperature peak emission energy versus alloy composition for undoped and nitrogen-doped GaAsP LEDs injected with a current density of 5A/cm2. Also shown is the energy gap of the direct-to-indirect (Egamma-to-EX) transition. The direct-indirect crossover occurs at x ≈ 50% (after Craford et al., 1972).
|
|
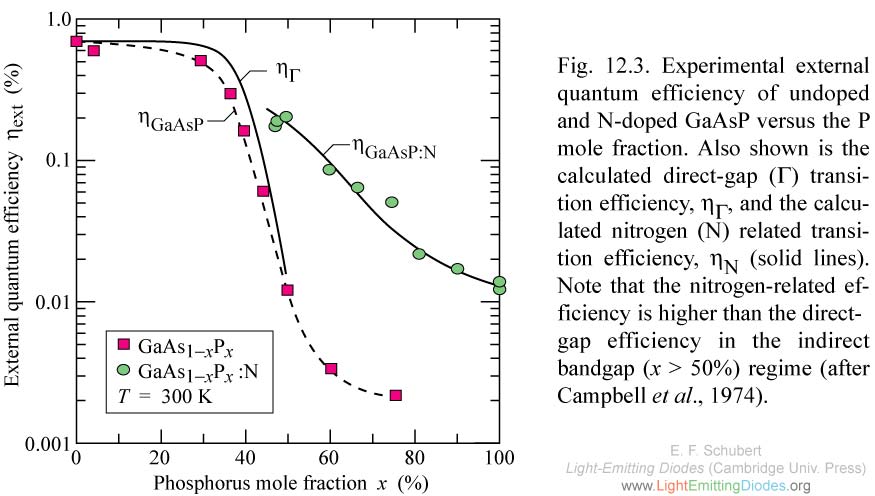
Fig. 12.3. Experimental external quantum efficiency of undoped and N-doped GaAsP versus the P mole fraction. Also shown is the calculated direct-gap (Gamma) transition efficiency, eta gamma, and the calculated nitrogen (N) related transition efficiency, eta N (solid lines). (after Campbell et al., 1974).
|
|
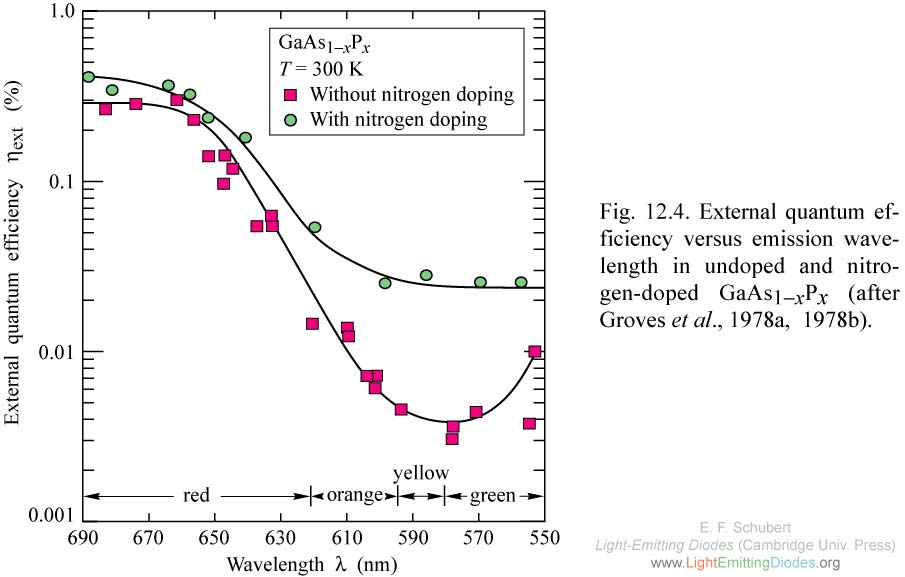
Fig. 12.4. External quantum efficiency versus emission wavelength in undoped and nitrogen-doped GaAs1-xPx (after Groves et al., 1978a, 1978b).
|
|
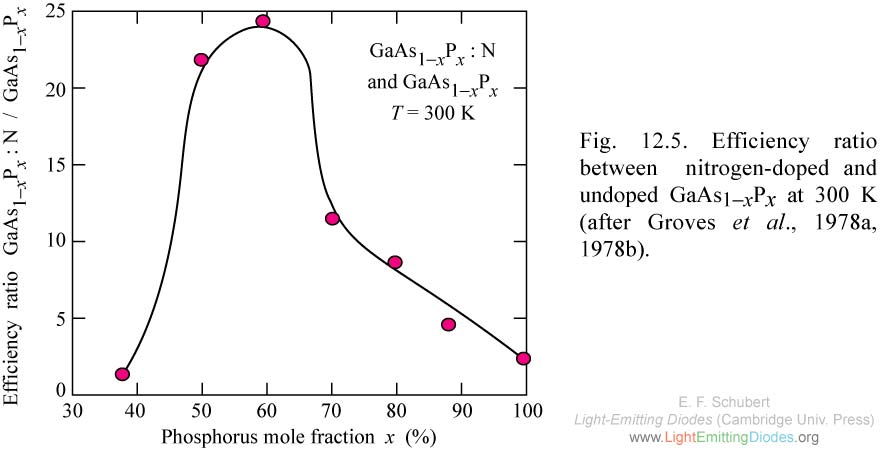
Fig. 12.5. Efficiency ratio between nitrogen-doped and undoped GaAs1-xPx at 300 K (after Groves et al., 1978a, 1978b).
|
|
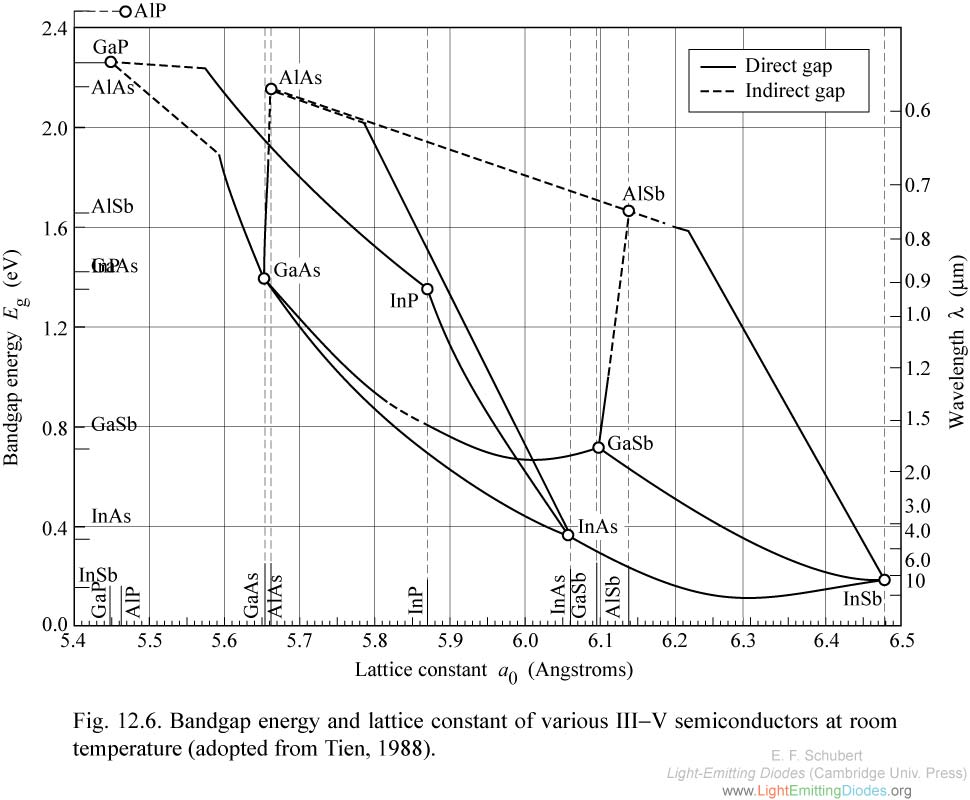
Fig. 12.6. Bandgap energy and lattice constant of various III-V semiconductors at room temperature (adopted from Tien, 1988).
|
|
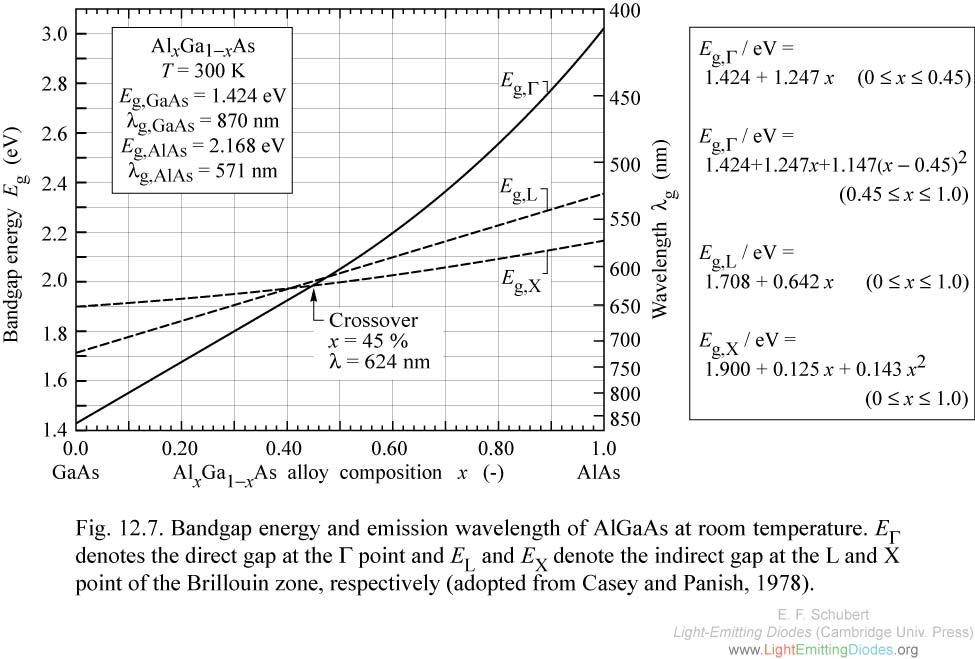
Fig. 12.7. Bandgap energy and emission wavelength of AlGaAs at room temperature. Egamma denotes the direct gap at the Gamma point and EL and EX denote the indirect gap at the L and X point of the Brillouin zone, respectively (adopted from Casey and Panish, 1978).
|
|
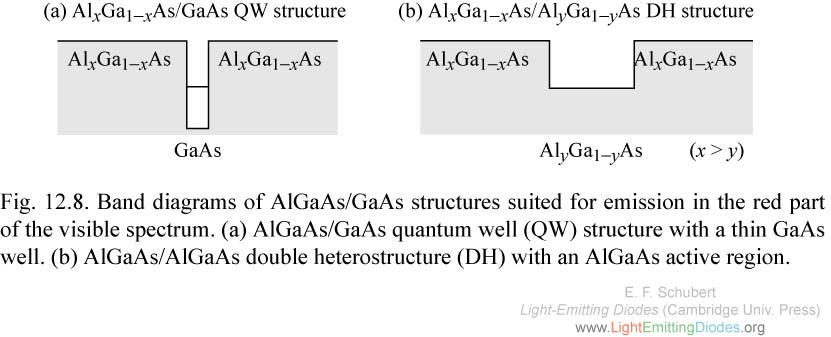
Fig. 12.8. Band diagrams of AlGaAs/GaAs structures suited for emission in the red part of the visible spectrum. (a) AlGaAs/GaAs quantum well (QW) structure with a thin GaAs well. (b) AlGaAs/AlGaAs double heterostructure (DH) with an AlGaAs active region.
|
|
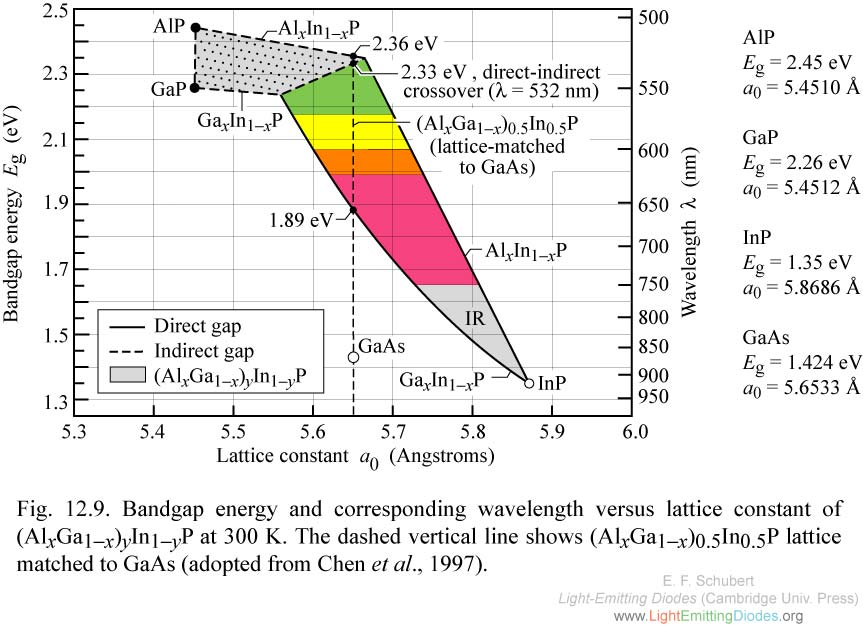
Fig. 12.9. Bandgap energy and corresponding wavelength versus lattice constant of (AlxGa1-x)yIn1-yP at 300 K. The dashed vertical line shows (AlxGa1-x)0.5In0.5P lattice matched to GaAs (adopted from Chen et al., 1997).
|
|
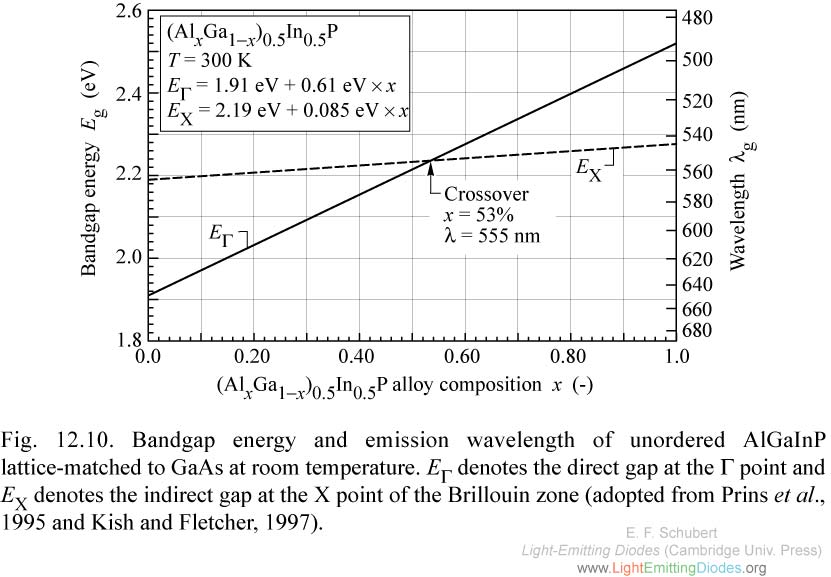
Fig. 12.10. Bandgap energy and emission wavelength of unordered AlGaInP lattice-matched to GaAs at room temperature. Egamma denotes the direct gap at the gamma point and EX denotes the indirect gap at the X point of the Brillouin zone (adopted from Prins et al., 1995 and Kish and Fletcher, 1997).
|
|
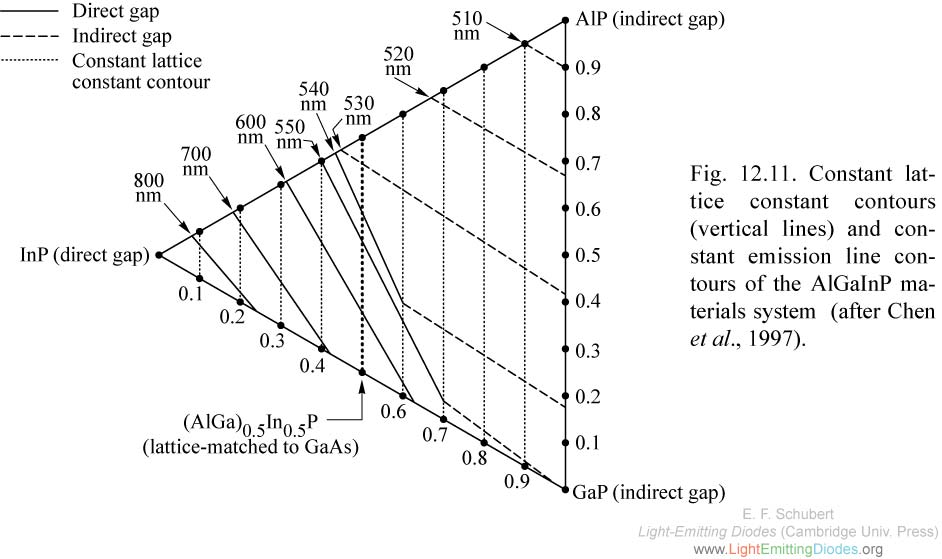
Fig. 12.11. Constant lattice constant contours (vertical lines) and constant emission line contours of the AlGaInP materials system (after Chen et al., 1997). |
|
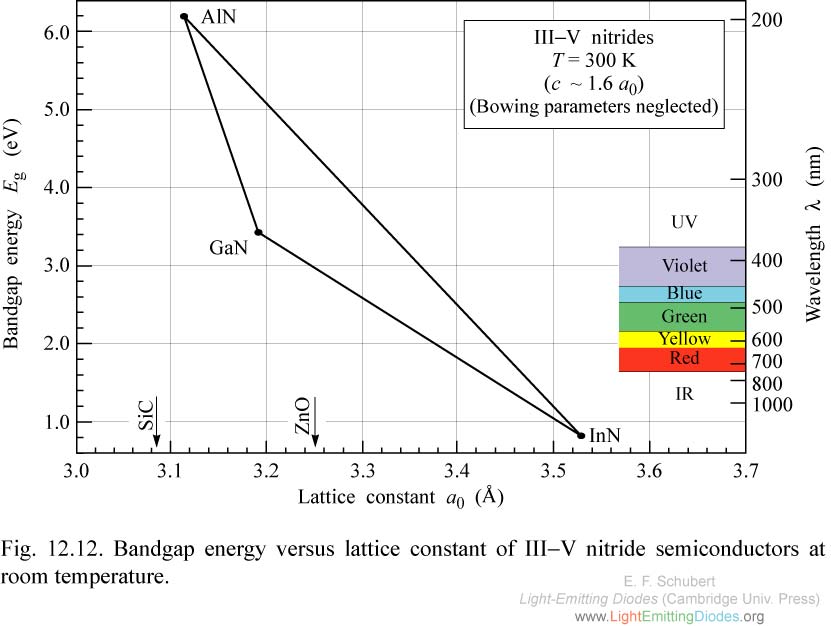
Fig. 12.12. Bandgap energy versus lattice constant of III-V nitride semiconductors at room temperature.
|

|
Fig. 12.13. Luminous efficiency of visible-spectrum LEDs and other light sources versus time (adopted from Craford, 1997, 1999, updated 2000).
|
|
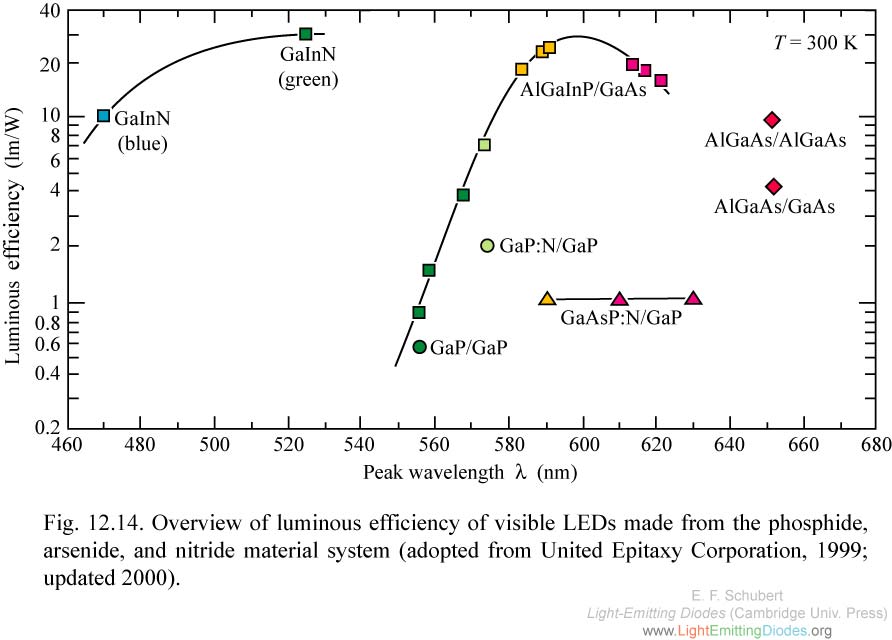
Fig. 12.14. Overview of luminous efficiency of visible LEDs made from the phosphide, arsenide, and nitride material system (adopted from United Epitaxy Corporation, 1999; updated 2000).
|
|
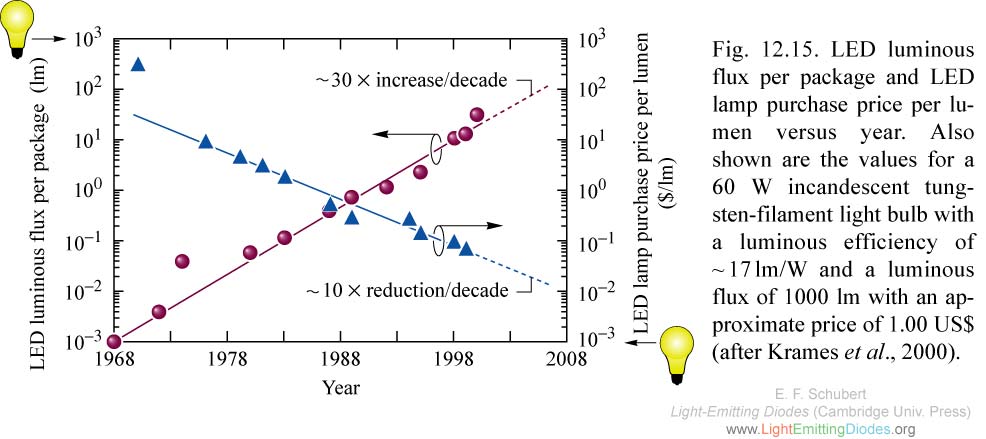
Fig. 12.15. LED luminous flux per package and LED lamp purchase price per lumen versus year. Also shown are the values for a 60 W incandescent tungsten-filament light bulb with a luminous efficiency of ~17lm/W and a luminous flux of 1000 lm with an approximate price of 1.00 US$ (after Krames et al., 2000).
|

|
Fig. 12.16. Typical emission spectrum of GaInN/ GaN blue, GaInN/GaN green, and AlGaInP/GaAs red LEDs at room temperature (after Toyoda Gosei Corp., 2000).
|
|
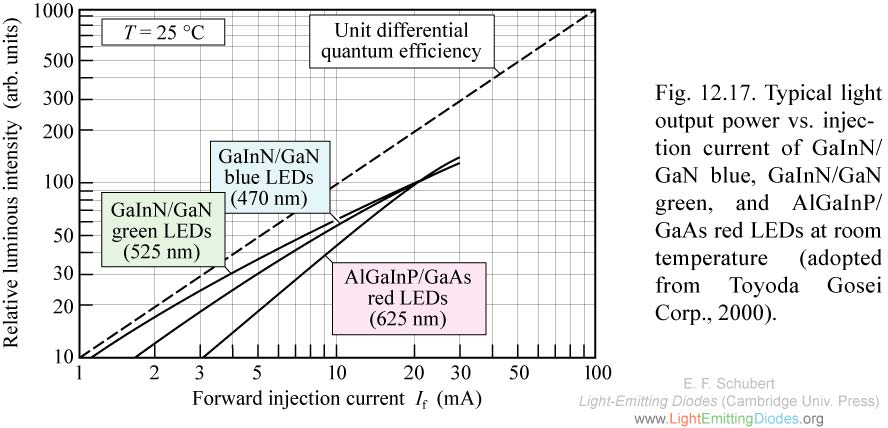
Fig. 12.17. Typical light output power vs. injection current of GaInN/ GaN blue, GaInN/GaN green, and AlGaInP/ GaAs red LEDs at room temperature (adopted from Toyoda Gosei Corp., 2000).
|
|
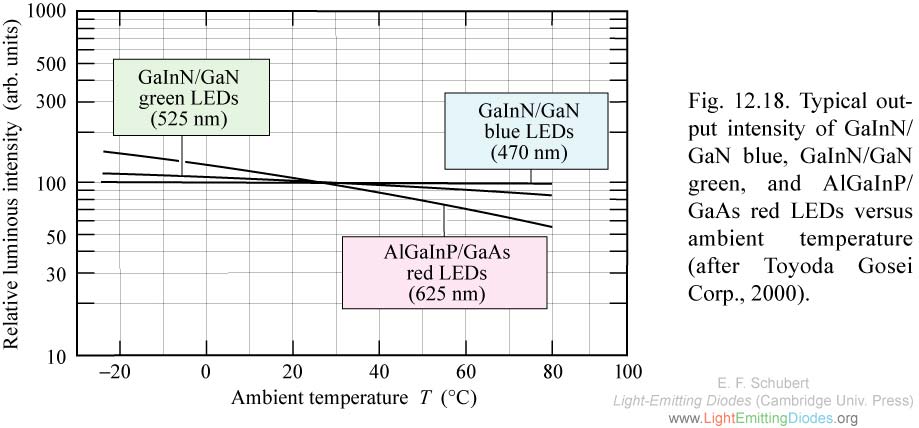
Fig. 12.18. Typical output intensity of GaInN/ GaN blue, GaInN/GaN green, and AlGaInP/ GaAs red LEDs versus ambient temperature (after Toyoda Gosei Corp., 2000).
|
|
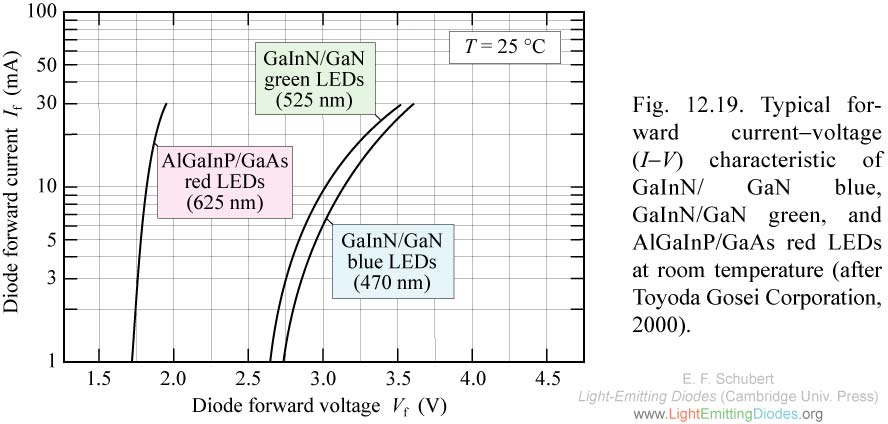
Fig. 12.19. Typical forward current-voltage (I-V) characteristic of GaInN/ GaN blue, GaInN/GaN green, and AlGaInP/GaAs red LEDs at room temperature (after Toyoda Gosei Corporation, 2000).
|
|
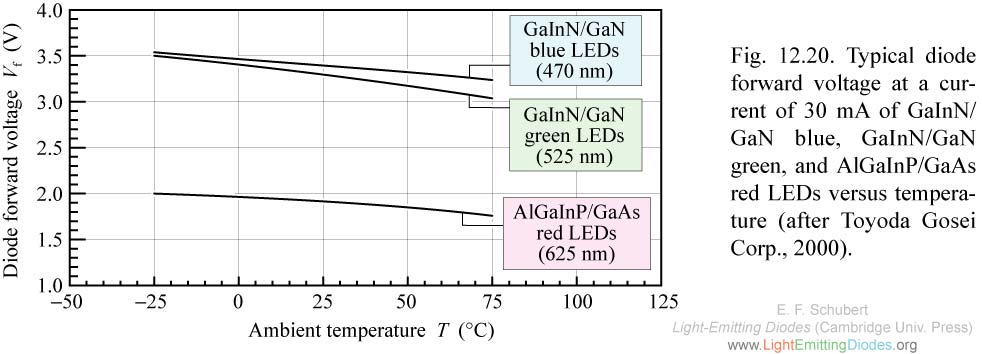
Fig. 12.20. Typical diode forward voltage at a current of 30 mA of GaInN/ GaN blue, GaInN/GaN green, and AlGaInP/GaAs red LEDs versus temperature (after Toyoda Gosei Corp., 2000).
|