|
Results and evaluation
|
|
|
|
Microtubule results and evaluation
|
|
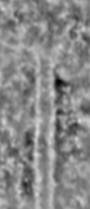
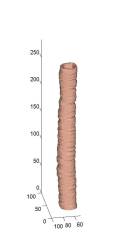
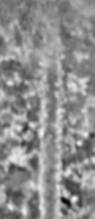
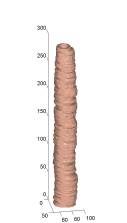
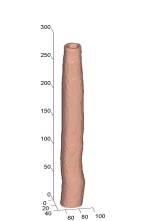
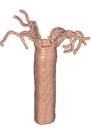
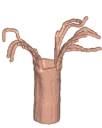
Segmented
microtubules
|
|
|
|

|
|
|
|
|
|
(left) selected slices of two volumes respectively. (middle)
manual segmentations. (right) automated segmentations
|
|
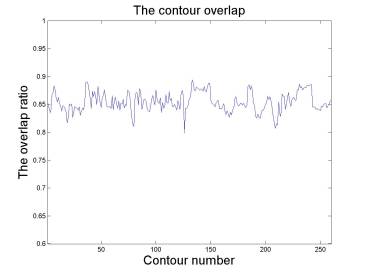
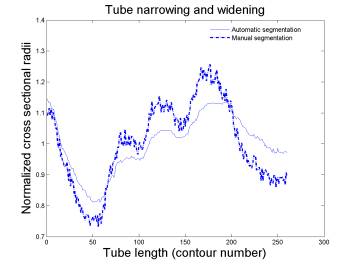
Evaluation by 2D contour area
|
|
|
|
|
(left) contour overlap ratio indicates the overall agreement
between automatic segmentation and manual segmentation. (right) manual and
automatic results have the same narrowing and widening trends
|
|
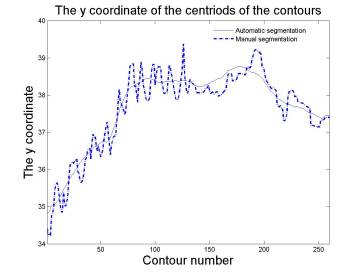
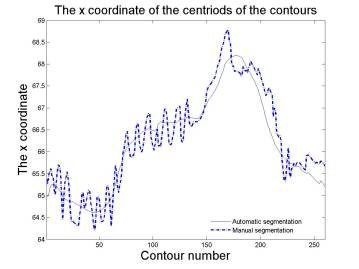
Evaluation
by position of central axes
|
|
|
|
|
Axes by manual segmentation and automated segmentation are
close to each other. Automated segmentation varies smooth, while manual
segmentation varies roughly
|
|
|
|
Plus-ends results and evaluation
|
|
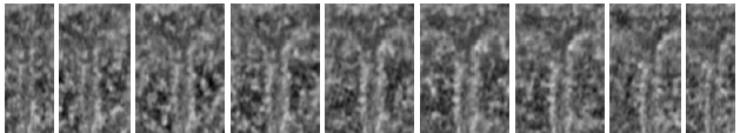
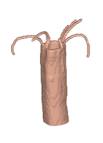
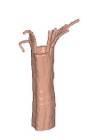
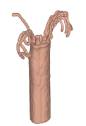
Plus-ends
traced automatically
|
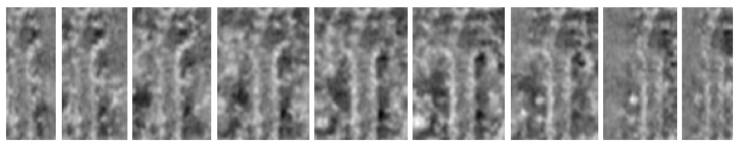
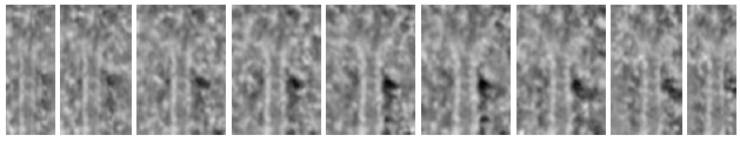
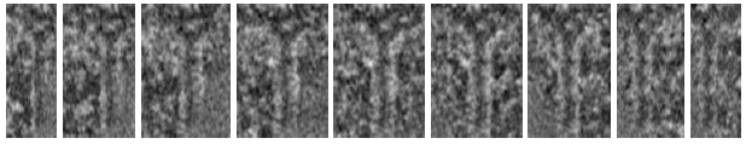
Corresponding
radial slices
|
|
|

|
|
|
|
|
|
|
|
|
|
|
|
|
|
Evaluation by classification
|
|
Classification
of plus-ends structures is the goal of the biological research behind this
work. By comparing classification based on automatic results with that
based on raw images, we can estimate how much useful information is
obtained through automated tracing. 80 test samples
are used: 18 curled, 22 forked and 40 blunt (no filament traced or very
short filament) plus-ends.
|
|
|
|
Confusion
table for three classes of plus-ends
|
|
True
Class ß
|
Curled
|
Forked
|
Blunt
|
|
Curled
|
0.78
|
0.22
|
0.00
|
|
Forked
|
0.14
|
0.68
|
0.18
|
|
Blunt
|
0.05
|
0.15
|
0.80
|
|
|
|
|
|
|
|